


Join a Community that Works Smart
There’s no shortage of talent in the Roanoke Region. Workers here are highly educated and ready to invest in their careers. Drawing people from a 60-mile radius, the Roanoke labor supply consists of more than 300,000 people, one-third of whom have bachelor’s degrees. And with 25 colleges and more than 100,000 students pursuing degrees in the region, new highly skilled people are joining the workforce every day.
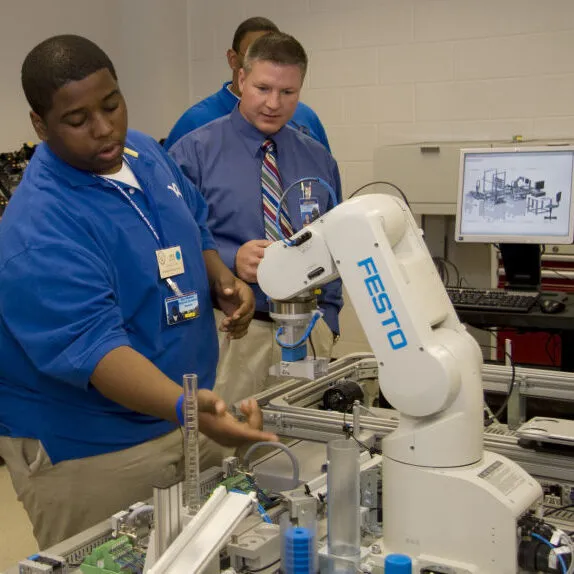
Roanoke also boasts unique advantages like its burgeoning biotechnology hub and nationally recognized workforce training and retraining programs. And the talent pool is growing. Roanoke ranks in the top 36 percent of all metros for prime workforce growth, outshining other southern cities like Memphis, TN; The Research Triangle, NC; and Tampa, FL.
300K
Workers
25
Colleges & Universities
100K
Students
Make your move to Roanoke
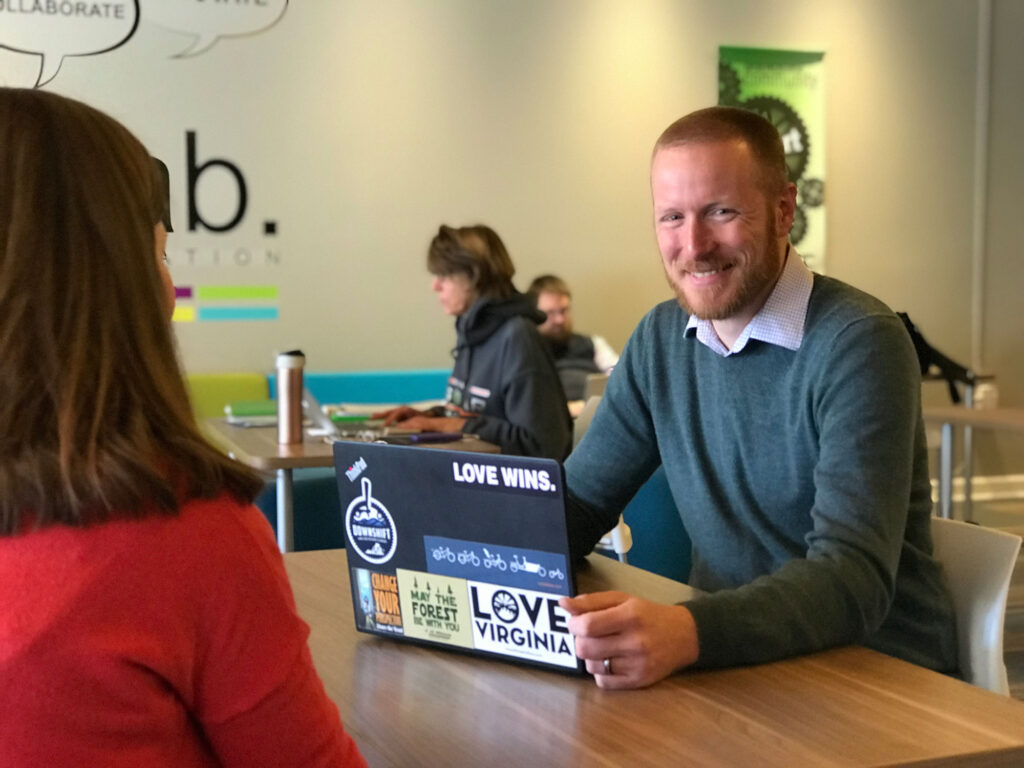
We’re here to connect you with the information you need to find the right neighborhoods, jobs, resources, and people to help you to #Get2KnowNoke. Curious about what it’s like to live and work here? Reach out to our Talent Ambassadors, many of whom moved here because of the livability, costs, and great connections.
Live here, work anywhere
With a remote job, you can work from anywhere; why not work somewhere with a killer outdoor scene, robust arts and culture, and nationally recognized dining options?
This Roanoke Region is the perfect metro-mountain mix. You can look out your window at the mountains (take in all that fresh air), hop downtown for farm-to-table dining, stock up at farmer’s markets with regional produce and meat, pedal with your kids along the greenway, or visit your new favorite brewery!

We’re here to help
The Roanoke Regional Partnership serves as the point of contact for businesses looking to relocate and expand. We are connectors who match your needs and questions with the resources and answers. We’re a one-stop-shop for learning, evaluating, and connecting with the Alleghany, Botetourt, Franklin, and Roanoke counties, cities of Covington, Roanoke, and Salem, and the town of Vinton.
Let us help you find the right site or building for companies, create custom research for your business decision, and connect you with the people and services that will help you see why the Roanoke Region is the right place.