


Building a Strong Workforce with Labor Supply and Training Opportunities
The workforce represents a range of talent combined with top-quality training. Our labor draw extends far beyond the boundaries of the region, attracting workers from areas within a 60-mile radius. That means the total labor supply consists of more than 300,000 people. And, with a high concentration of colleges and universities and training programs, new highly-skilled people are joining the workforce all the time. It’s no wonder why businesses from all over the world choose the Roanoke Region for business.
- Low unionization and practically non-existent work disruptions due to labor disputes; Virginia is a right-to-work state.
- Consistently low absenteeism.
- With more than 6,000 high school and 25,000 college graduates annually, highly educated and skilled workers are constantly entering the labor force.
- As a leader in high-tech research, innovation, and development, Virginia Tech is educating students in new technology and information fields.
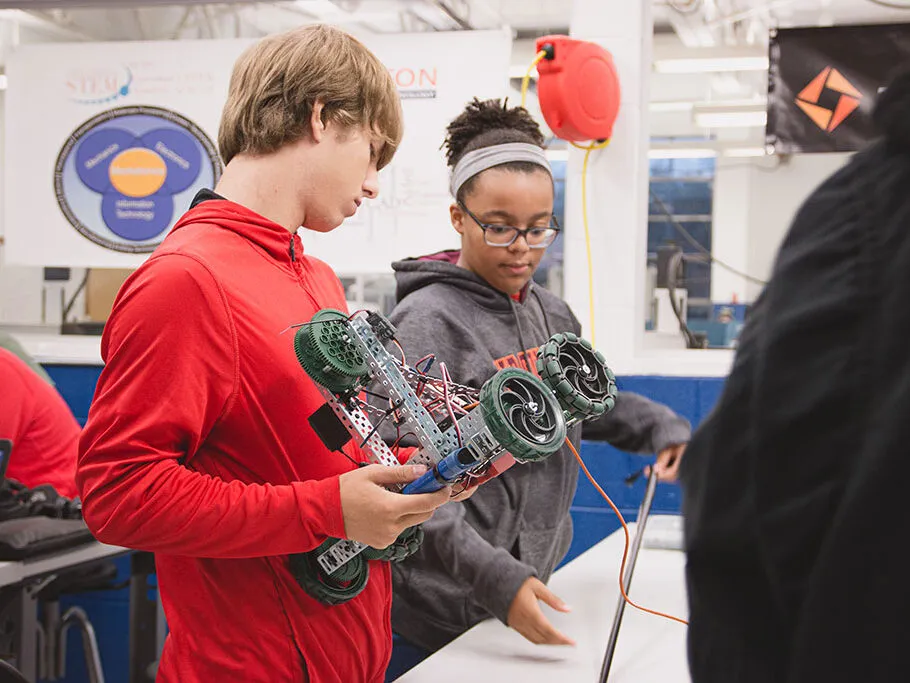
- Nationally recognized workforce training, retraining programs, and training facilities are available.
- Dedicated, in-house talent attraction brand, Get2KnowNoke, to support both talent and businesses.
Labor Force
| Roanoke Region Population (2023) | 328,707 |
| Labor Area Total Population (2022) | 650,578 |
| Labor Force-Supply Area (2017-2021) | 313,142 |
| Total Unemployed Persons-Labor Supply Area (2017-2021) | 12,790 |
| Unemployment Rate (Roanoke MSA-12/23) | 2.7% |
| Underemployment Estimate (2021) | 24% |
| Annual High School Graduates (19-20) | 6,700 |
| Annual Two-Year Graduates (20-21) | 2,099 |
| Annual Four-Year Degree and Higher Graduates (20-21) | 36,704 |
| Absenteeism | 2.8% |
Alleghany Highlands Submarket
| Labor Force | 74,609 |
| Unemployed | 2,449 |
| Unemployment Rate | 3.6% |
Franklin County Submarket
| Labor Force | 267,846 |
| Unemployed | 8,664 |
| Unemployment Rate | 3.2% |
Roanoke MSA Educational Attainment
| High School Diploma/GED or higher | 90.5% |
| Some college, no degree | 19.7% |
| Associate’s or bachelor’s degree | 28.2% |
| Graduate or professional degree | 10.6% |
Occupation Distribution
| Occupation Title | 2018 | 2028 (projected) | Change (projected) |
|---|---|---|---|
| Administrative and Support | 10,279 | 10,343 | .6% |
| Ambulatory Health Care Services | 8,053 | 9,651 | 19.8% |
| Architectural, Engineering | 1,303 | 1,249 | -4.1% |
| Business Support Services | 1,448 | 1,538 | 6.2% |
| Computer Systems Design | 2,720 | 3,696 | 35.9% |
| Construction | 9,054 | 9,494 | 4.9% |
| Construction of Buildings | 1,727 | 2,012 | 16.5% |
| Health and Education Services | 37,563 | 40,373 | 7.5% |
| Financial Activities | 7,974 | 8,156 | 2.3% |
| Food Prep, and Drinking Places | 12,530 | 13,262 | 5.8% |
| Information | 1558 | 1541 | -1.1% |
| Insurance Carriers and Related | 3,505 | 3,686 | 5.2% |
| Leisure and Hospitality | 15,728 | 16,479 | 5.0% |
| Management, Scientific, and Technical | 481 | 544 | 13.1% |
| Manufacturing | 17,073 | 16,479 | -3.5% |
| Medical and Diagnostic Labs | 513 | 728 | 41.9% |
| Nursing and Residential Care Facilities | 5,262 | 5,492 | 12.9% |
| Professional and Business Services | 23,363 | 24,314 | 4.1% |
| Professional, Scientific, and Technical | 7,838 | 8,941 | 14.1% |
| Trade, Transportation, and Utilties | 34,018 | 33,056 | -2.8 |
| Truck Transportation | 2,575 | 2,854 | 10.8 |
| Warehousing and Storage | 1546 | 1651 | 6.8 |
| Total | 172,475 | 176,183 | 2.1% |
Grow your people and your business
Workforce development can make all the difference in helping your business thrive. In the Roanoke Region, you have access to unparalleled resources like Get2KnowNoke, Greater Workforce Development Board, Community Colleges, and Virginia Economic Development Partners. In other words, you have everything you need to ensure your employees grow alongside your business.

Learn More about the Roanoke Region of Virginia